DataHorse transforms how users engage with data analysis by allowing queries through natural language, providing an intuitive approach to statistical significance testing. Let’s delve deeper into how DataHorse supports common statistical tests.
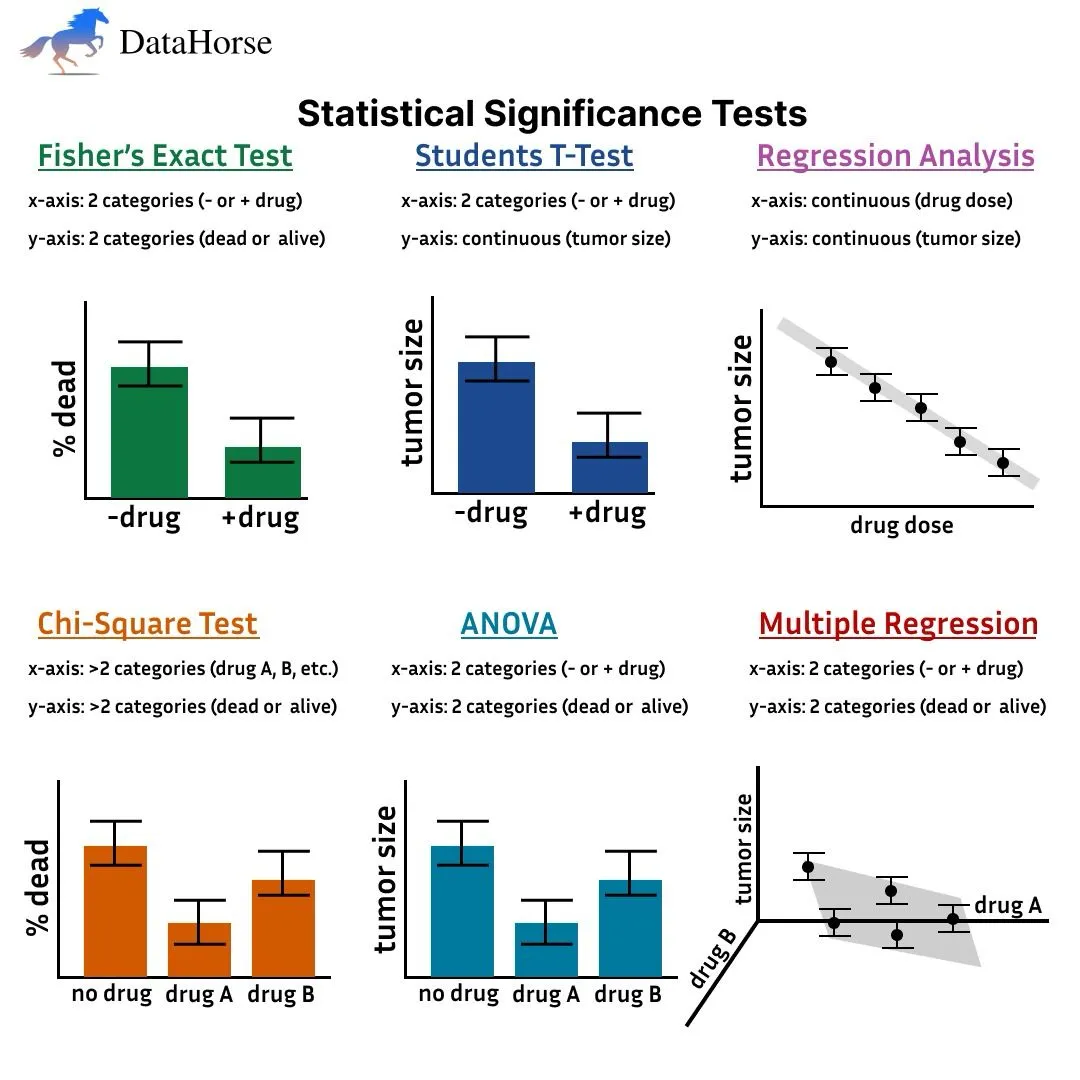
1. Fisher’s Exact Test:
Fisher’s Exact Test is often used to determine if there is a significant association between two categorical variables, like drug administration and survival rates in clinical studies. In traditional analysis, you’d need to code this explicitly, but DataHorse simplifies it:
df.chat('Is there a relationship between drug administration and survival?')
This command analyzes the contingency table for two binary variables (e.g., drug vs. no drug, alive vs. dead). The test is ideal for small sample sizes, and the result helps determine if survival is associated with treatment.
2. Student’s T-Test:
This test compares the means of two groups to see if the difference is statistically significant. In drug trials, you might want to compare tumor sizes between treated and untreated groups. Using DataHorse:
df.chat('Compare the average tumor size for patients who received the drug versus those who did not.')
The t-test assumes normally distributed data and equal variances. DataHorse outputs the Python code, allowing you to modify assumptions, such as whether to use a two-sample t-test or a paired t-test, depending on your data structure.
3. Regression Analysis:
Regression analysis helps establish relationships between continuous variables. For example, if you’re studying how tumor size changes with increasing doses of a drug
df.chat('What is the relationship between drug dose and tumor size?')
This command generates a linear regression model, helping you understand the strength and direction of the relationship between drug dosage and tumor size. You can further explore the effect by adjusting the model’s assumptions, such as adding interaction terms or testing for non-linearity.
4. Chi-Square Test:
When analyzing categorical data with more than two levels, such as survival across multiple drugs (A, B, C), the Chi-Square test evaluates if observed frequencies differ significantly from expected ones:
df.chat('Is there a difference in survival rates between drugs A, B, and C?')
The test is commonly used in epidemiology or genetics. DataHorse runs the test, calculates the p-value, and shows the Python code for customization, such as adjusting for continuity corrections or expected frequency thresholds.
5. ANOVA (Analysis of Variance):
ANOVA is essential when you want to compare means across more than two groups. In a drug efficacy study, you might want to test whether tumor sizes differ across multiple drug treatments:
df.chat('Compare tumor sizes across different drug treatments.')
ANOVA assumes normal distribution and homogeneity of variances. DataHorse allows you to inspect the Python code, so you can adjust for one-way or two-way ANOVA depending on whether you have one or more independent variables.
6. Multiple Regression:
When exploring how multiple factors (like drug type and dosage) affect an outcome (e.g., tumor size), multiple regression helps model these relationships:
df.chat('Analyze the effect of drug type and dosage on tumor size.')
This test extends linear regression by including more than one predictor variable. DataHorse generates the regression model and provides insights into each variable’s contribution. You can tweak the code to explore interaction effects, polynomial terms, or check for multicollinearity.
Learning Through Code:
One of DataHorse’s standout features is its Code Review capability. Every query generates the corresponding Python code, allowing users to learn or modify it for more advanced analyses. You can start with a simple test and then explore more complex adjustments, making it a perfect tool for both beginners and experienced data scientists.
For instance, after running a t-test, you might want to apply a log transformation to normalize your data or change the test to a one-sided t-test. With DataHorse, you see the Python code and can make these adjustments on the fly, thus building a deeper understanding of both statistical analysis and programming.
Conclusion:
DataHorse offers an innovative way to perform statistical significance tests using plain English, breaking down barriers for those unfamiliar with coding. Whether you’re conducting a simple t-test or a more complex multiple regression analysis, DataHorse makes the process intuitive while helping you learn Python along the way.
Try DataHorse today and simplify your data analysis journey!