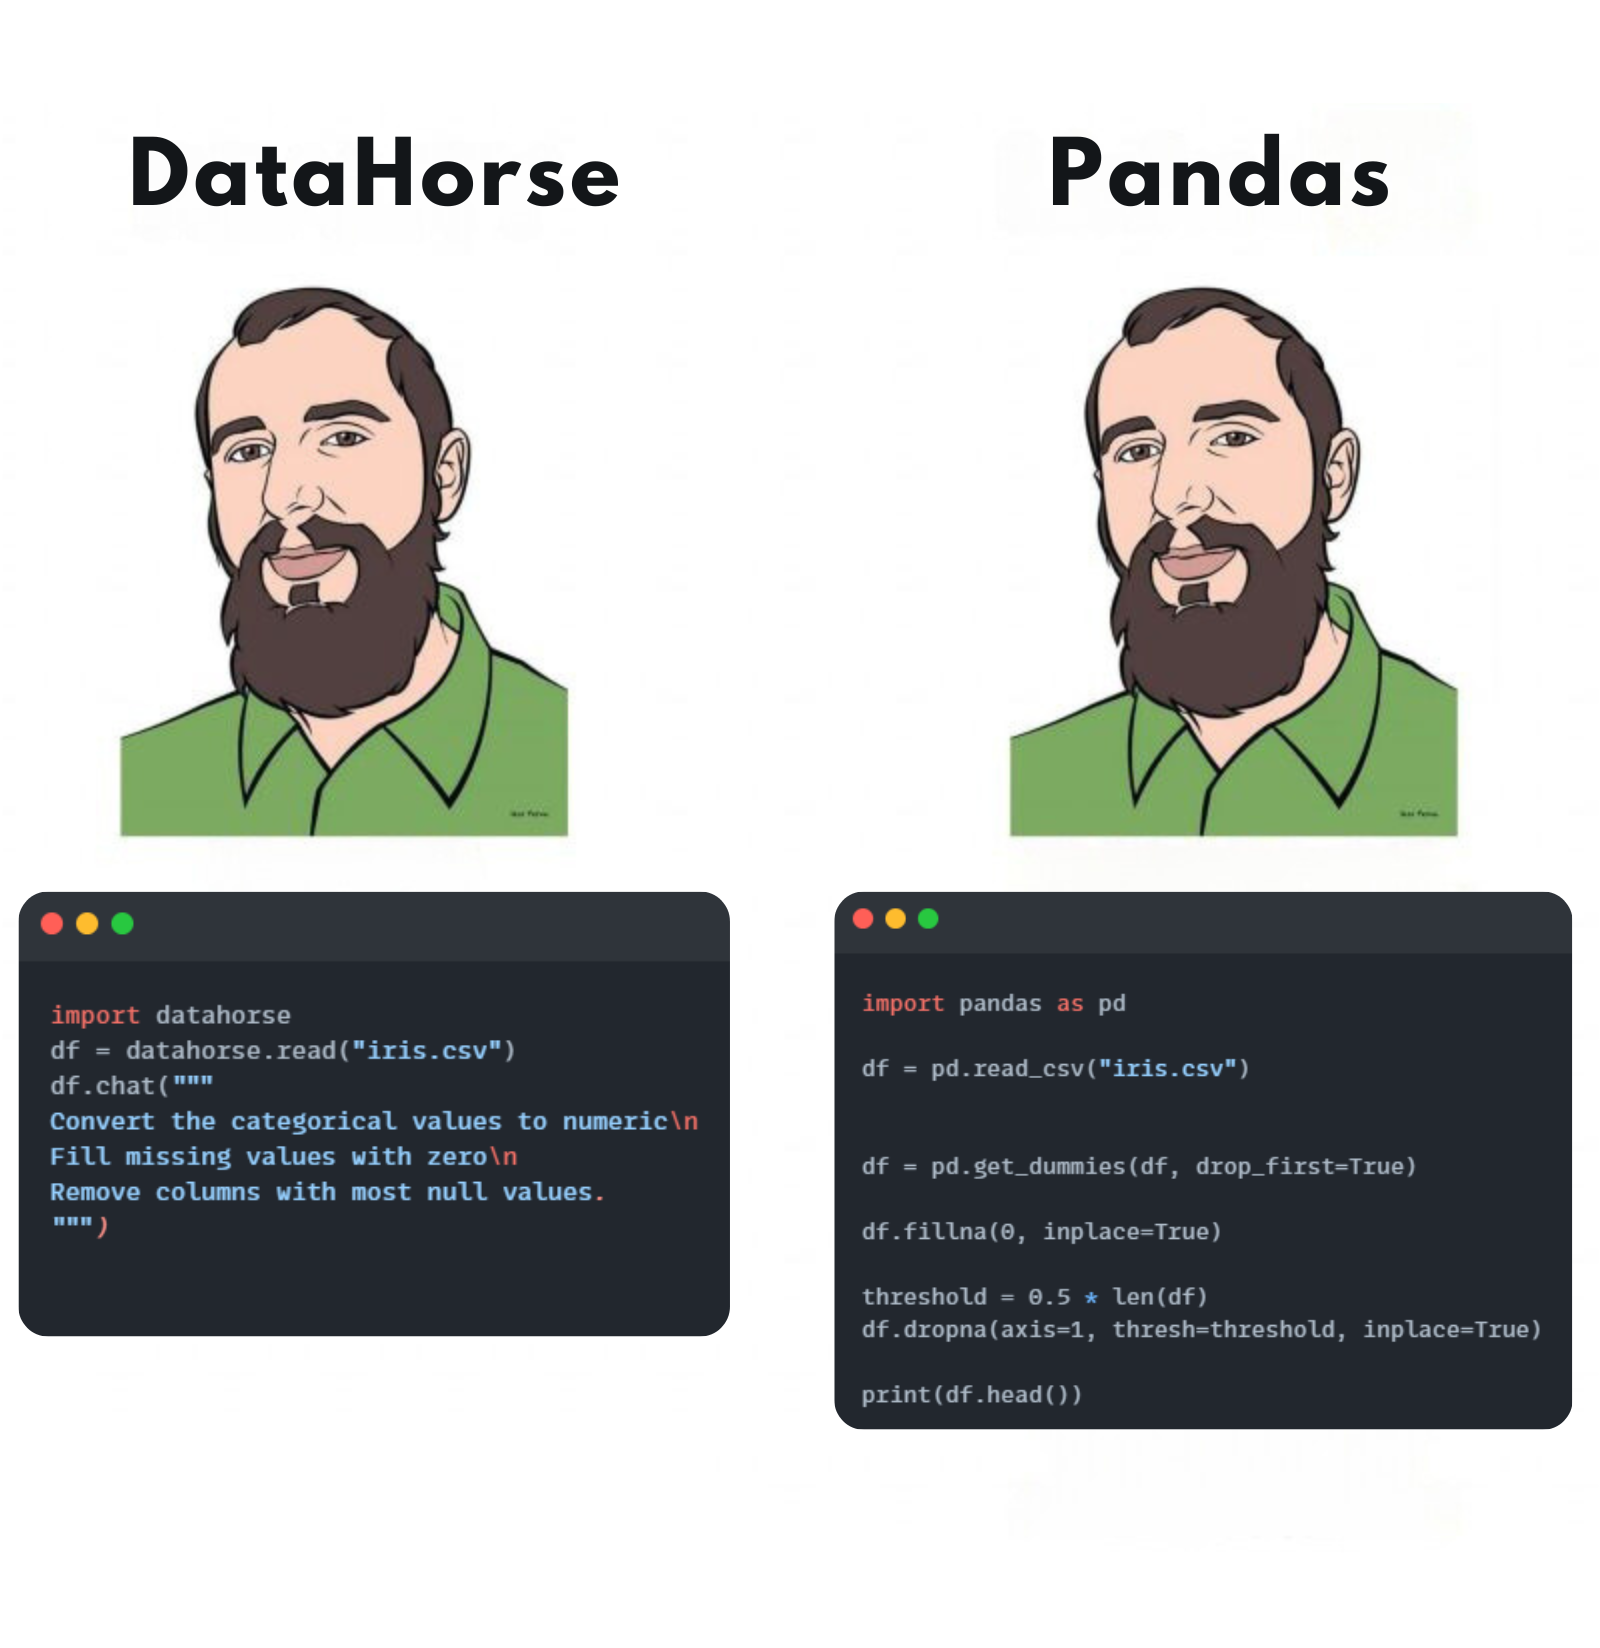
When it comes to data science in Python, Pandas has been the go-to tool for years. But a new contender is emerging, and it's designed to simplify data interaction like never before. Say hello to DataHorse, an open-source Python library that lets you work with data using plain English commands 📝, no technical expertise required.
Let’s explore how DataHorse stacks up against the tried-and-true Pandas, and why it might be the perfect tool for your next project.
Pandas: The Data Science Workhorse 🐼
Pandas is widely respected for its powerful data manipulation capabilities. It provides high-performance, easy-to-use data structures like DataFrames, which are ideal for handling tabular data. With Pandas, you can slice, dice, clean, transform, and visualise your datasets with precision.
However, Pandas has a learning curve. To get the most out of it, you need to be comfortable with programming, understanding key concepts like indexing, applying functions, and writing complex queries. While the rewards of mastery are immense, beginners often feel overwhelmed by the syntax and functionality.
Here’s a typical Pandas example:
                #python

                import pandas as pd


                # Load data

                df = pd.read_csv('iris-data.csv')


                # Data transformation

                df['species_code'] = df['species'].astype('category').cat.codes

                df['petal_area'] = df['petal_length'] * df['petal_width']


                # Queries

                average_measurements = df.groupby('species')[['sepal_length', 'petal_width']].mean()

                species_count = df['species'].value_counts()

                largest_petal_length = df.loc[df['petal_length'].idxmax()]['species']


                # Plotting

                df.plot.scatter('sepal_length', 'petal_length', c='species')

                df['petal_width'].plot.hist()

                df.boxplot(column='sepal_length', by='species')
To unlock its full potential, users often turn to tutorials or detailed documentation. And while Pandas excels in performance and flexibility, you’ll need to code each step.
DataHorse: Data Science Made Effortless 🐴
DataHorse, on the other hand, revolutionises data interaction by allowing users to chat with their data in plain English. Its mission is to make data science accessible to everyone, whether you’re a business professional or a student with no technical background.
Here's how it works: Instead of writing code, you simply ask questions or give instructions in natural language. This makes it incredibly intuitive for users to query, modify, and visualise their data, skipping the need for learning programming syntax.
Let’s compare the same tasks using DataHorse:
                #python

                import datahorse


                # Load data

                df = datahorse.read('https://raw.githubusercontent.com/plotly/datasets/master/iris-data.csv')


                # Data transformation

                df = df.chat('convert species names to numeric codes')

                df = df.chat('add a new column "petal_area" calculated as petal_length * petal_width')


                # Queries

                average_measurements = df.chat('what are the average sepal length and petal width for each species?')

                species_count = df.chat('how many samples are there for each species?')

                largest_petal_length = df.chat('which species has the largest petal length?')


                #Plotting

                df.chat('scatter plot of sepal length vs petal length by species')

                df.chat('histogram of petal width')

                df.chat('box plot of sepal length distribution by species')
With DataHorse, there’s no need to write any code beyond basic setup. You simply tell it what you want, and it responds with the result. Want to add a column or get the average of a specific value? Just ask! Need a plot? Request it, and DataHorse will handle the rest.
Key Differences
1. Ease of Use:
- Pandas: Requires knowledge of Python and coding techniques.
- DataHorse: Operates using natural language; no programming experience necessary.
2. Learning Curve:
- Pandas: Steep, especially for beginners unfamiliar with Python.
- DataHorse: Almost zero; you can start interacting with data immediately without tutorials.
3. Flexibility:
- Pandas: Extremely flexible and customizable. Best suited for complex data manipulations.
- DataHorse: Simplifies common tasks but may lack the depth needed for highly specialised operations.
4. Audience:
- Pandas: Data scientists, engineers, and analysts who are comfortable with programming.
- DataHorse: Business users, students, and individuals without technical skills who need quick insights.
When to Use DataHorse
- For Quick Insights: If you need to quickly explore and visualise your data without writing a line of code.
- For Non-Technical Teams: When teams want to leverage data without hiring a data scientist or learning to code.
- For Prototyping: Rapidly generate insights during meetings or discussions where speed and clarity matter more than advanced features.
When to Use Pandas
- For Complex Data Operations: When you need full control over every aspect of data transformation.
- For Performance: If you’re working with very large datasets or require custom performance optimizations.
- For Data Engineering: Pandas is ideal for creating complex pipelines and workflows.
The Verdict
DataHorse is democratizing data science by making it accessible to everyone, regardless of their background. Its natural language approach makes it a perfect fit for businesses, educators, and individuals who want to understand their data without diving into code.
Pandas remains an excellent choice for experienced programmers who need power, flexibility, and control. But if you’re looking for a faster, more intuitive way to work with data,
DataHorse is a game-changer. Whether you're a seasoned data professional or just getting started, DataHorse opens the door to data science for all. 🌟
Ready to try DataHorse? Just install it and see the magic unfold!
                #install datahorse


                pip install datahorse
pip install datahorse