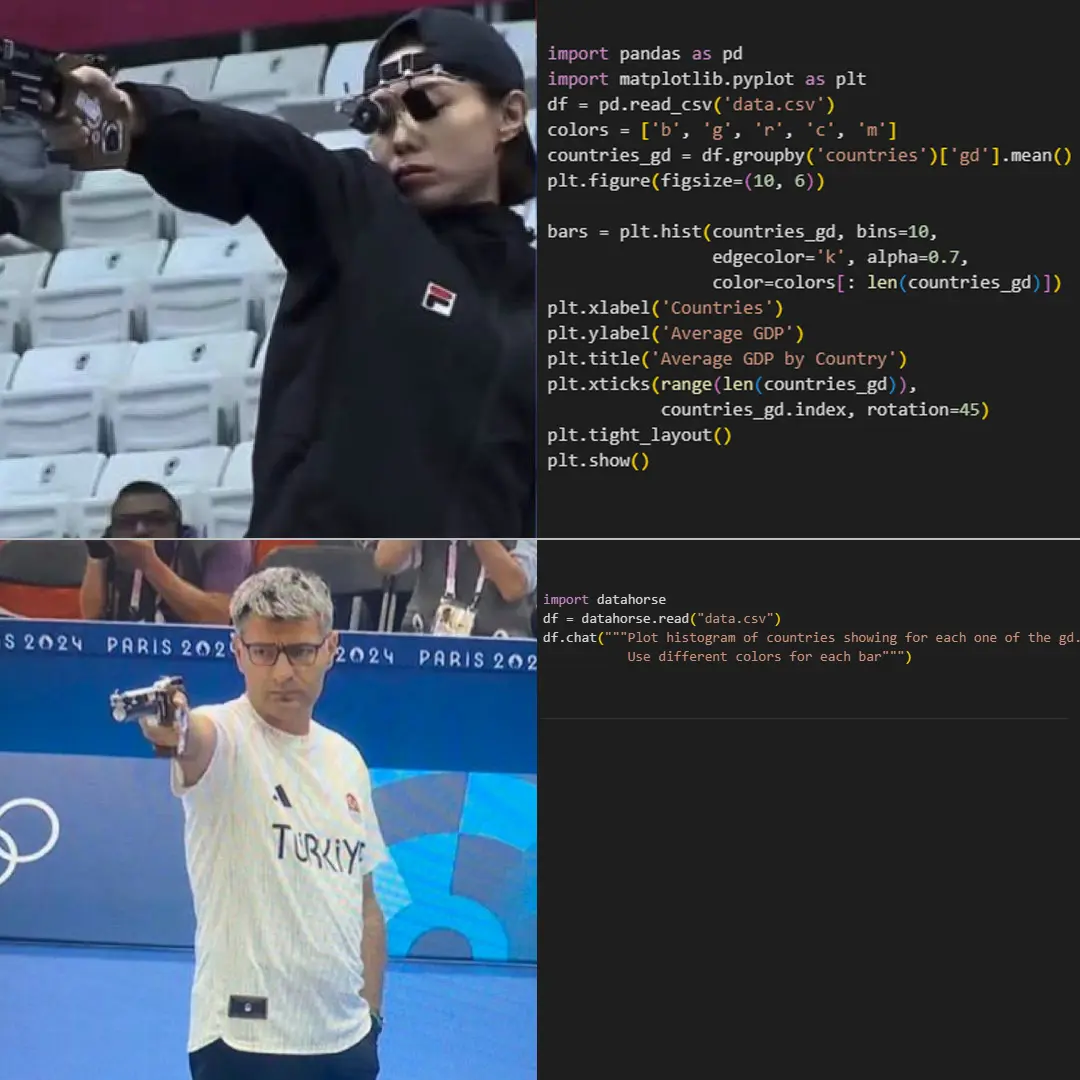
In the world of data science, Pandas has long been the go-to tool for data manipulation and analysis. However, a new player, DataHorse, is reshaping how both non-technical users and seasoned professionals interact with data. DataHorse, with its unique plain English interface, is designed to democratise data science, making it easier than ever to manipulate, analyse, and visualise data without needing to write complex code
Let’s compare DataHorse and Pandas, focusing on how they handle common data tasks such as importing data, manipulating datasets, and visualising insights.
1. Installation and Setup
Both DataHorse and Pandas are installed using Python's package manager.
- Pandas
Installation is straightforward using the command:
pip install pandas
- DataHorse
Installation is equally simple:
pip install datahorse
However, the key difference lies not in installation but in user experience after setup. While Pandas requires the user to know Python and its functions, DataHorse allows users to engage with datasets in plain English
2. Loading and Exploring Data
Pandas:
In Pandas, users must write specific Python code to load and explore data. For example:
                #python

                import pandas as pd

                df = pd.read_csv('data.csv')

                df.head()
import pandas as pd
df = pd.read_csv('data.csv')
df.head()
To get information about columns, data types, and more, users need commands like `df.info()` and `df.describe()`
DataHorse:
DataHorse simplifies the process. Instead of writing code, users can **ask** for the dataset to be displayed:
                #python
                import datahorse

                df = datahorse.read('data.csv')

                df.chat('show me the first 10 rows')
df = datahorse.read('data.csv')
df.chat('show me the first 10 rows')
DataHorse instantly displayed the data in a neat table, while allowing users to inquire about columns in natural language such as:
"What columns are in this dataset?"
3. Data Transformation
Pandas:
Data transformation in Pandas involves more technical syntax. For example, to create a new column based on existing data:
                #python
                df['new_column'] = df['column1'] * df['column2']
As shown in the screenshots, DataHorse handled complex transformations like adding new columns based on mathematical operations or modifying values in the dataset, all through simple requests.
4. Data Queries and Aggregation
Pandas:
To perform calculations such as finding the average, sum, or count, Pandas requires multiple lines of code:
                #python

                df.groupby('species')['sepal_length'].mean()
df.groupby('species')['sepal_length'].mean()
DataHorse:
DataHorse’s natural language interface makes it accessible to users who are not familiar with programming. For instance, to calculate averages:
                #python

                df.chat('what are the average sepal length and petal width for each species?')
df.chat('what are the average sepal length and petal width for each species?')
This is especially beneficial for users who want quick answers without diving into complex code. The images show how DataHorse instantly outputs these queries in a structured format.
5. Data Visualization
Pandas + Matplotlib/Seaborn:
Pandas relies on external libraries like Matplotlib or Seaborn for data visualisation. Users must write multiple lines of code:
                #python

                import matplotlib.pyplot as plt

                df.plot(kind='scatter', x='sepal_length', y='petal_length')
                plt.show()
import matplotlib.pyplot as plt
df.plot(kind='scatter', x='sepal_length', y='petal_length') plt.show()
DataHorse:
In contrast, DataHorse allows users to simply ask for visualisations:
                #python

                df.chat('scatter plot of sepal length vs petal length by species')
df.chat('scatter plot of sepal length vs petal length by species')
In the screenshots, we see visualisations such as bar charts and pie charts generated by simple English commands. This eliminates the need for learning visualisation libraries, making the process faster and more intuitive.
6. Summary of Differences
Pandas vs. DataHorse: A Feature Comparison
| Feature | Pandas | DataHorse |
|---|---|---|
| Installation | pip install pandas |
pip install datahorse |
| Learning Curve | Requires Python knowledge | No programming needed |
| Data Loading | Code-based (pd.read_csv) |
Natural language (df.chat('load data')) |
| Data Queries | Code (groupby, mean, etc.) |
Plain English (what is the average?) |
| Data Visualization | Requires libraries (Matplotlib, Seaborn) | Instantly generated via commands |
| Target Audience | Data scientists, analysts | Data scientists, analysts, non-technical users, business leaders |
7. Conclusion
Both Pandas and DataHorse are incredibly powerful tools, but they serve different audiences. Pandas is ideal for data scientists who are comfortable writing code and need granular control over their data. On the other hand, DataHorse brings data science to everyone, empowering users to work with data using natural language commands. This makes it especially useful for non-technical professionals who want to leverage data-driven insights without the steep learning curve.
DataHorse represents the future of data interaction, reducing the complexity associated with traditional tools like Pandas and allowing anyone to analyse, manipulate, and visualise data effortlessly.